There are no items in your cart
Add More
Add More
| Item Details | Price | ||
|---|---|---|---|

Track 300+ Coins in Seconds
{{DATE}}
Checking 300+ charts manually to gauge actual market breadth is soul-crushing. By the time you finish, the market has already moved. In this guide, I'll show you how to build a Python-based market sentiment scanner that tracks all Binance perpetual futures against their 50, 100, and 200-day moving averages—in seconds, not hours.
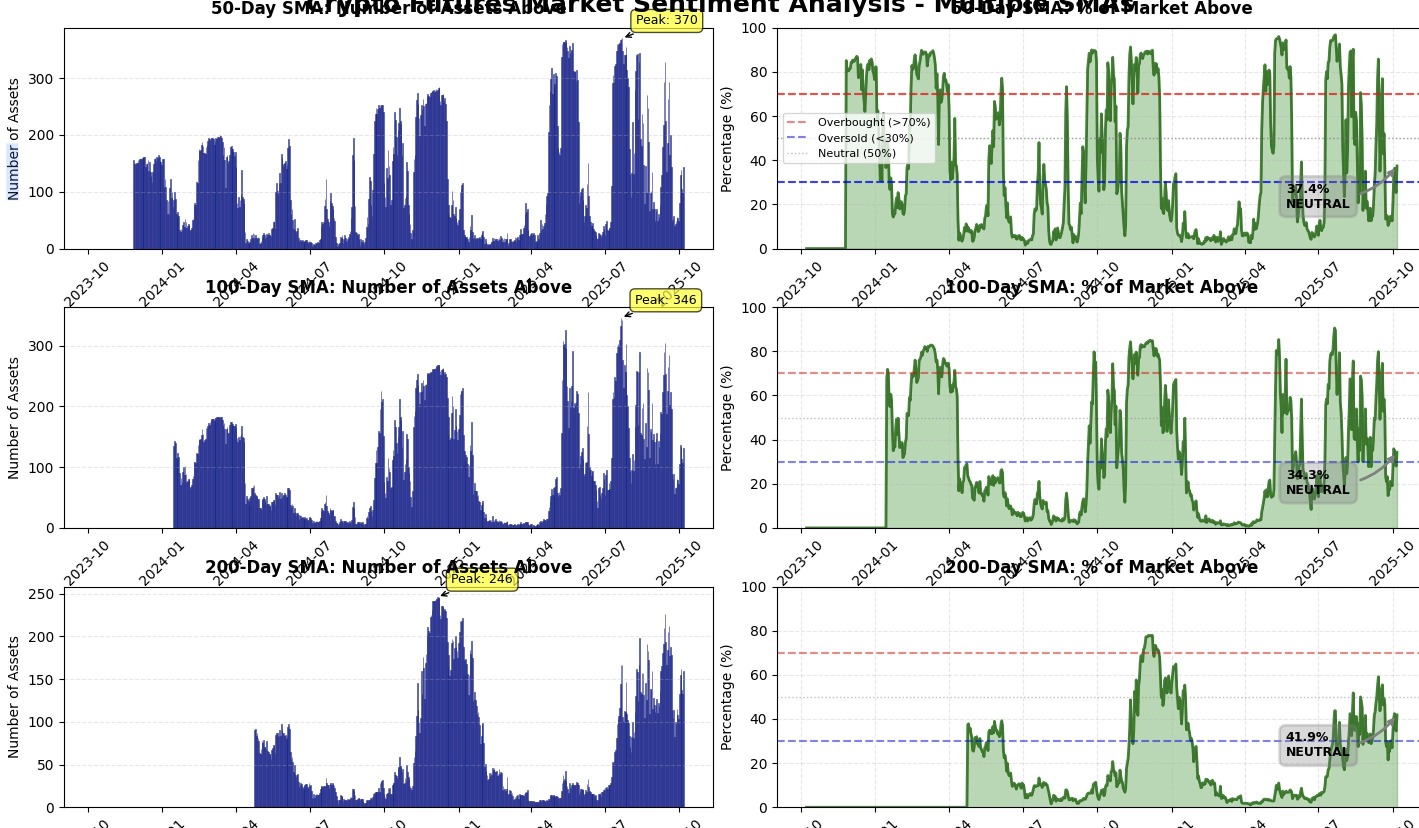
As of now, Bitcoin trades at all-time highs. Great news, right? Here's the reality from our scanner: Current Readings:
What Happens Next? Historically, strong Bitcoin rallies eventually pull altcoins higher. The lag can be weeks or months, but when breadth expands from 35% → 60%+, that's when altcoin seasons accelerate.
The Three Timeframe Approach Most traders only check one moving average. That's leaving money on the table. Here's why you need all three: 50-Day SMA (Short-Term Sentiment):
I need to build a crypto market sentiment scanner in Python that:1. Connects to Binance and downloads historical data for all perpetual futures (no API key required, use public data via ccxt library)2. Calculates 50-day, 100-day, and 200-day simple moving averages for each asset3. Determines how many assets are trading above each moving average4. Creates visualizations showing:- Bar charts of absolute count of assets above each SMA over time- Percentage charts showing market breadth with overbought (70%) and oversold (30%) zones- Comparison charts overlaying all three SMAs5. Provides summary statistics including:- Current market sentiment classification- Historical averages and extremes- Sentiment distribution over timeRequirements:- Use ccxt for data (no API keys)- Use pandas for data manipulation- Use ta library for SMA calculations- Use matplotlib for visualizations- Make it object-oriented and well-documented- Include progress indicators during data download- Handle errors gracefullyThe goal is to gauge overall crypto market sentiment, not generate trading signals. I want to see market-wide participation trends.
Here's the github link for the code i have generated using ai crypto market sentiment
This is what the code does
Markets reward those who see reality clearly, not those who see it optimistically. Bitcoin at all-time highs is a fact. But it's not the full story. The full story is told by market breadthand now you have a tool to measure it objectively, automatically, and repeatedly. While others are debating on Twitter whether it's a bull market, you'll have data showing exactly how many assets are participating. While others are checking charts manually, you'll have automated the entire process. While others are trading on emotion, you'll be trading on evidence. That's the edge.
Remember: Bitcoin is the leader. When it reaches new highs, it often pulls the market higher over the following weeks. The scanner will show you when that rotation is actually happening not when people say it's happening. Use the code. Track the data. Make better decisions.
{{AUTHOR}}
A Full Time Algo Trader
 Launch your Graphy